
As we’ve hit a bit of a lull in the Road Race Championship I thought it might be fun interesting slightly informative to have look at some of the numbers behind the standings at the half way point. In no way is this demonstration of me having spreadsheet withdrawal. If you don’t like numbers, graphs and bad puns there’s a 92% probability you’ll stop reading at this point.
The RRC kicked off with 250 runners in total and I think it’s a real testament to Andy, and everyone else who’s helped, that there’s been some impressive turnouts of Striders at the races so far:
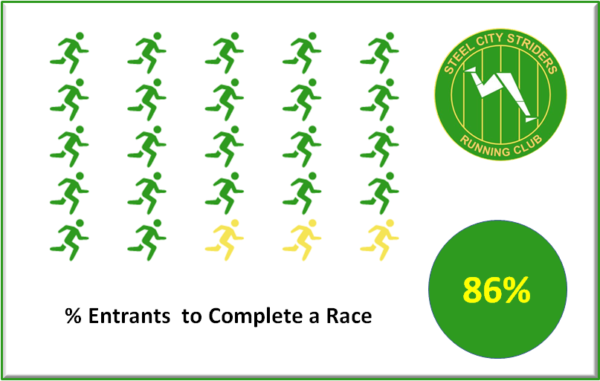
A whopping 86% of runners so far have completed at least one race which isn’t bad at all when you factor in there was always going to be injuries, suspensions and spring marathons.
What about the divisions themselves, has there been any real difference in turnout from division to division?

If we look at the total race distance per division (i.e. the total distance run by each runner in that division) we can see the stairway leads to division 7, with its members having covered 984.8 KM so far. Perhaps unsurprisingly it’s the Prem that’s covered the least distance, as these finely tuned machines require careful management and a steady supply of flapjack.
Knowing how far each runner has run and their total time, we can also compare the average pace across each division. Although there are no real surprises, it’s not as linear a progression as one might expect. There’s a bunching around divisions 5, 6, 7 suggesting there’s not a huge amount of difference between runners here, and on any given Sunday a runner from 7 is capable of beating one from 5. It was always going to be a tough job aligning the divisions with varying degrees of background on runners so I think this shows the decent job Andy did.
However the RRC isn’t about division vs division, it’s about runner vs runner. The stare downs on the start line, the mind games, the words of “encouragement” as you pass each mid-race, the accidental trips and of course the wholly sincere congratulations after. That being said then, who has been coming out on top so far? If we look just at total points accrued across each division:
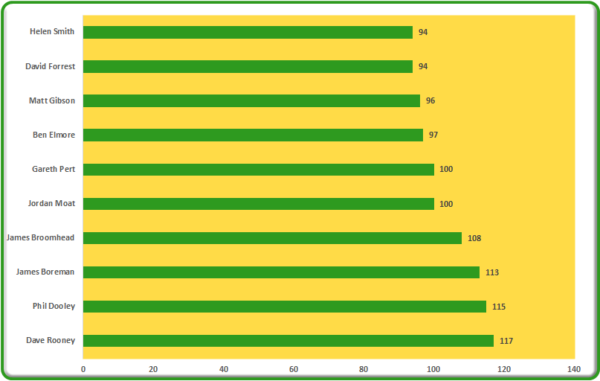
It’s fairly to safe that say that Dave Rooney, Phil Dooley, James Boreman and James Broomhead have secured themselves promotion at the very least, so congratulations to them. However, as not everyone has completed 6 races yet, is this best way to compare how dominant a runner has been in their division? There is another way we can look at things:

By taking the average finish time for each race in a division and seeing far ahead/behind a runner is to this mean we can calculate across all races combined the average percentage margin by which they are faster/slower than their peers. This neatly gives us a nice unit for comparing runners, the Vaporfly (VF), where 1 VF is equivalent to being 4% faster than others in your division.
Looking at the above graph then, we can see that on average Sharon Renshaw is 3.5 Vaporflys ahead of the rest of her division, and it would be a good assumption that were she to complete 6 races she has a good chance of promotion at the very least. It’s unsurprising to see the likes of Daniel Driscoll and Katie Morris featuring, given some of the dominant performances they’ve also put in. Interestingly Jordan Moat, despite dominating Div 3 and running some Premiership level times is “only” 2 VFs ahead of his peers on average.
As we pass the turn for the home straight for the RRC watch this space for further updates around who needs what for promotion/relegation/European qualification. If I get time, I might even do a predictor tool to let people do their own what ifs….